Business management app
UX/UI design for desktop app
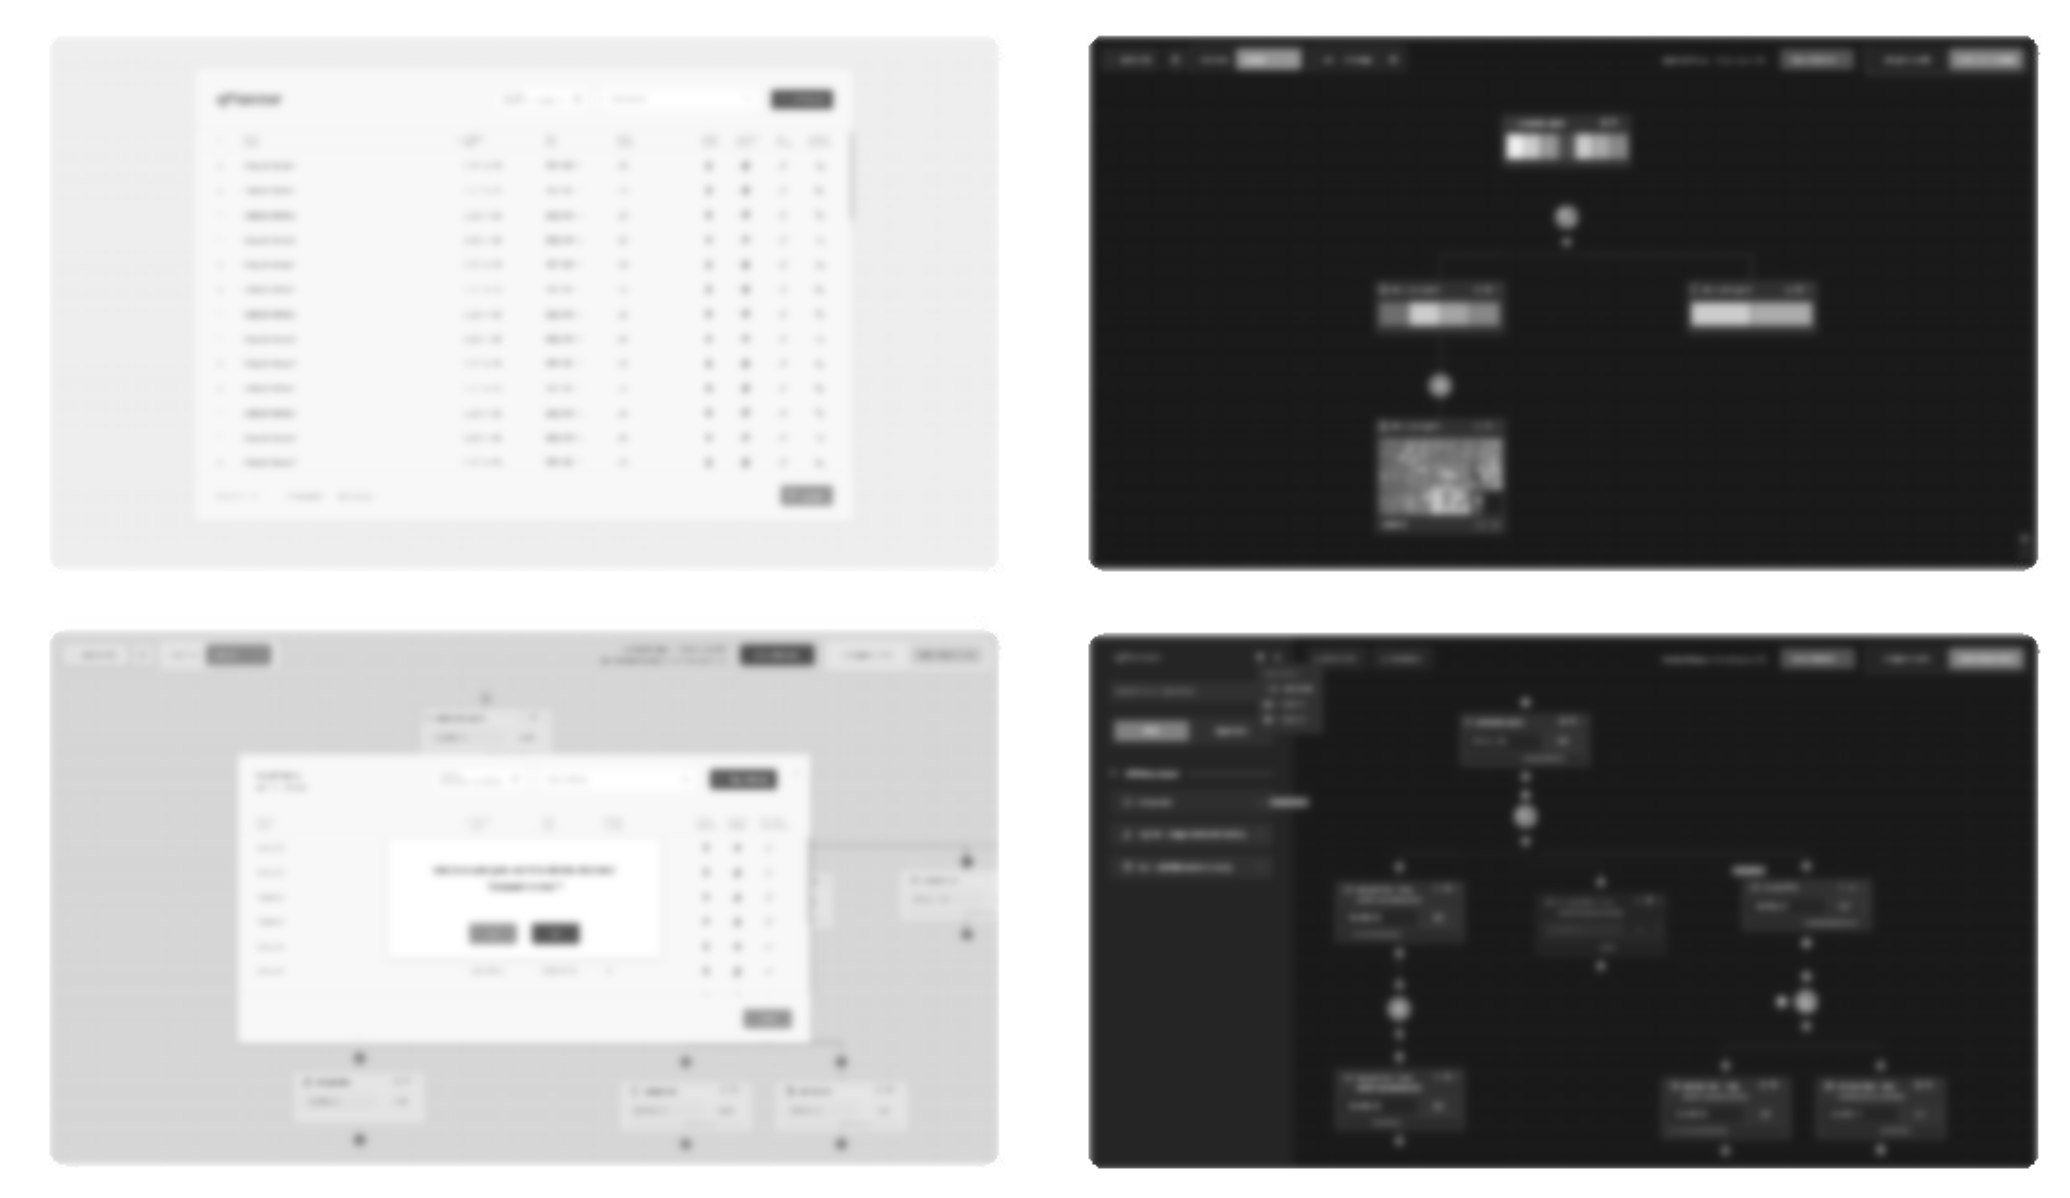
The goal was to create an intuitive, visually cohesive tool to support complex data management and project workflows. A key part of the project involved designing advanced comparative functionalities, allowing users to analyze multiple data sets side-by-side and track performance trends over time. I developed interactive charts, KPI dashboards, and heatmaps to provide users with clear, actionable insights. These tools were designed to adapt to various user roles and contexts, ensuring both clarity and flexibility in data exploration.
Main tasks
- development of new functionalities
- cooperation with developers
- meetings with clients and presenting developed solutions
Results
- login screen, project version management
- editing modes, permission management
- improving the mechanics of connecting mock panels on mood boards
- developing functionality and UI for charts
- visual modes for displaying mathematical data
- dark mode version